


Momentum investing is a strategy that’s aligned with purchasing securities that are showing an upward trend in value, or selling securities that are showing a downward trend. This is a popular form of investment that is relatively easy to pick up and is relatively secure in theory.
Despite being easy for investors to adopt, momentum trading isn’t foolproof, and its merits are the subject of some debate among experienced economists.
Some economists argue that there is a significant level of risk associated with momentum investing. However, if there is a strong enough indicator of progress over time, the rewards could be significantly valuable.
Other experienced investors write the strategy off as buying into ‘herd mentality bias’, which runs the risk of causing a bubble that builds ahead of an asset’s real value.
But how does momentum investing work? And just how effective is the approach? Let’s take a deeper look at the reactive world of momentum investing:
Key facets of momentum investing
The viability of momentum investing is clear. Unlike with fundamental or value investing, momentum investors look away from a company’s overall performance on the market. Momentum investing relies on analysing the many performance indicators of an asset in order to determine the overall strength of an upward trend. This helps to indicate the momentum of market prices.
Momentum investors also bring other factors into account. Most significantly, the behaviour of their fellow market investors. Capitalising on behavioural biases can significantly boost the short term value of certain assets and build on the effectiveness of specific momentum investing strategies.
How momentum works
Those undertaking a momentum-based investment strategy aim to build profits from either the purchase or sale of securities when they are strongly trending. When the price action momentum is high – whether the trend is positive or negative – the momentum investor will act.
The markets that are ripe for momentum investing tend to be more volatile ones. This is because high volatility will cause fluctuating levels of momentum in a short space of time for investors to capitalise on.
As such, momentum investing is typically a short-term strategy and requires plenty of attention. Traders look to a range of technical indicators like trend lines, moving averages and other varied indicators like ADX to help inform their decisions over trends.
When momentum is developing and a trend is emerging, the investor acts on the basis of the direction said trend is taking. When momentum begins to weaken, an investor looks to leave their position long before any kind of trend reversal takes place – ideally when a healthy profit has been secured.
Analysing trends
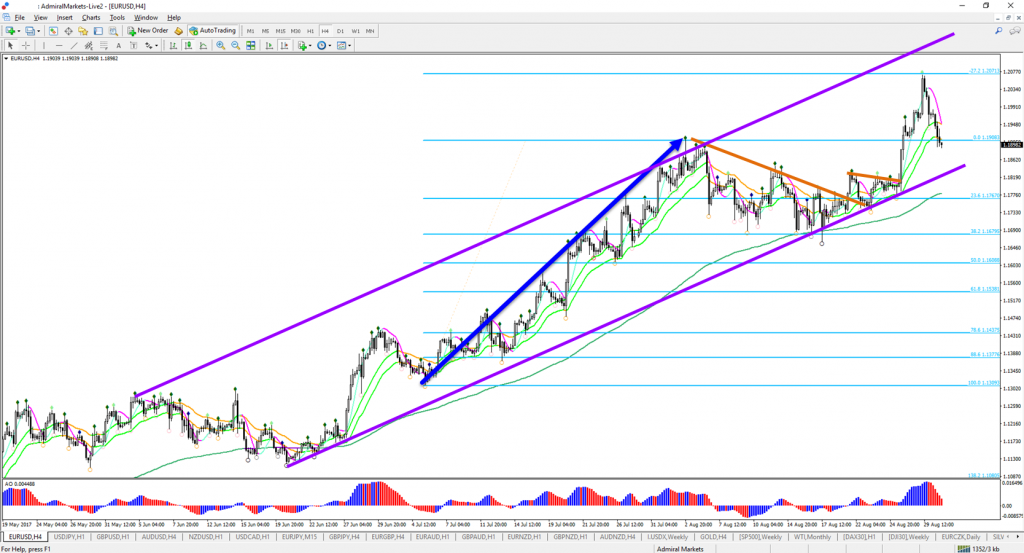
(Image: Elite CurrenSea)
Here we can see an example of a trending asset. Analysing trends is an excellent way of monitoring momentum for investors.
One of the most commonly accepted approaches comes in the form of mapping out trend lines. This helps to provide a clear indicator of the margins that you’re dealing with over a designated space of time.
Trend lines are drawn between two successive points on a price chart. If the line is sloping upwards, this indicates a positive trend and a bull market, which means it’s possible to buy shares in the anticipation of the upwards slope continuing. If the line is, in fact, downward-facing, then it’s a clear indication that it may be time to sell.
Of course price charts can change significantly in appearance based on the time frame you’re investigating, so it’s best to go in with a clear idea of how much evidence you need to gather regarding a trend before making a purchase or orchestrating a sale.
On the diagram above, two lines are drawn out in purple. These signify the Resistance Trend line (at the top), and the Support Trend line (at the bottom). Resistance and support help to show where the momentum is uniformed within its correlation. In more volatile markets, prices will likely fluctuate at a constant rate, so it’s important to use resistance and support lines to see what direction the trend is taking over longer periods of time.
The law of averages
The green and amber lines on the example above also illustrate the importance of averages while engaging in momentum investing.
Moving average lines help to cancel out much of the market noise that arises from small and sharp price fluctuations of an asset. When a security’s price remains aligned with an upwards-facing moving average, it provides strong evidence of an emerging uptrend. Whereas, if the price continually falls below a moving average, or the average line begins to turn downwards, this indicates a negative trend, and it could be time to sell up.
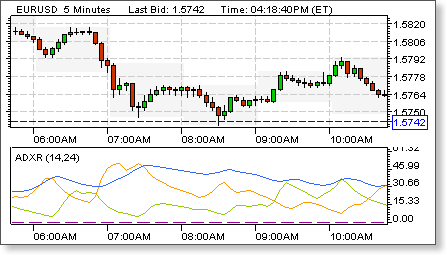
(Image: NiftyLiveCharts)
Above, we can see an example of the Average Directional Index (ADX) in action. This momentum indicator has become so popular that it’s hard to miss when analysing markets, and is accepted as a fairly reliable way of determining the existence of trends and their respective strengths.
ADX is formulated by calculating the increase, or decrease, in a security’s value over a specified time frame.
The values encased in ADX range from zero to 100. Values of 25 or under indicate that no real trend is emerging, while readings above this figure show clear signs of momentum in either direction. Higher readings show stronger trends, ie if an ADX reading of 55 is shown, this will indicate a stronger trend than a reading of, say, 45.
Oscillations and directions
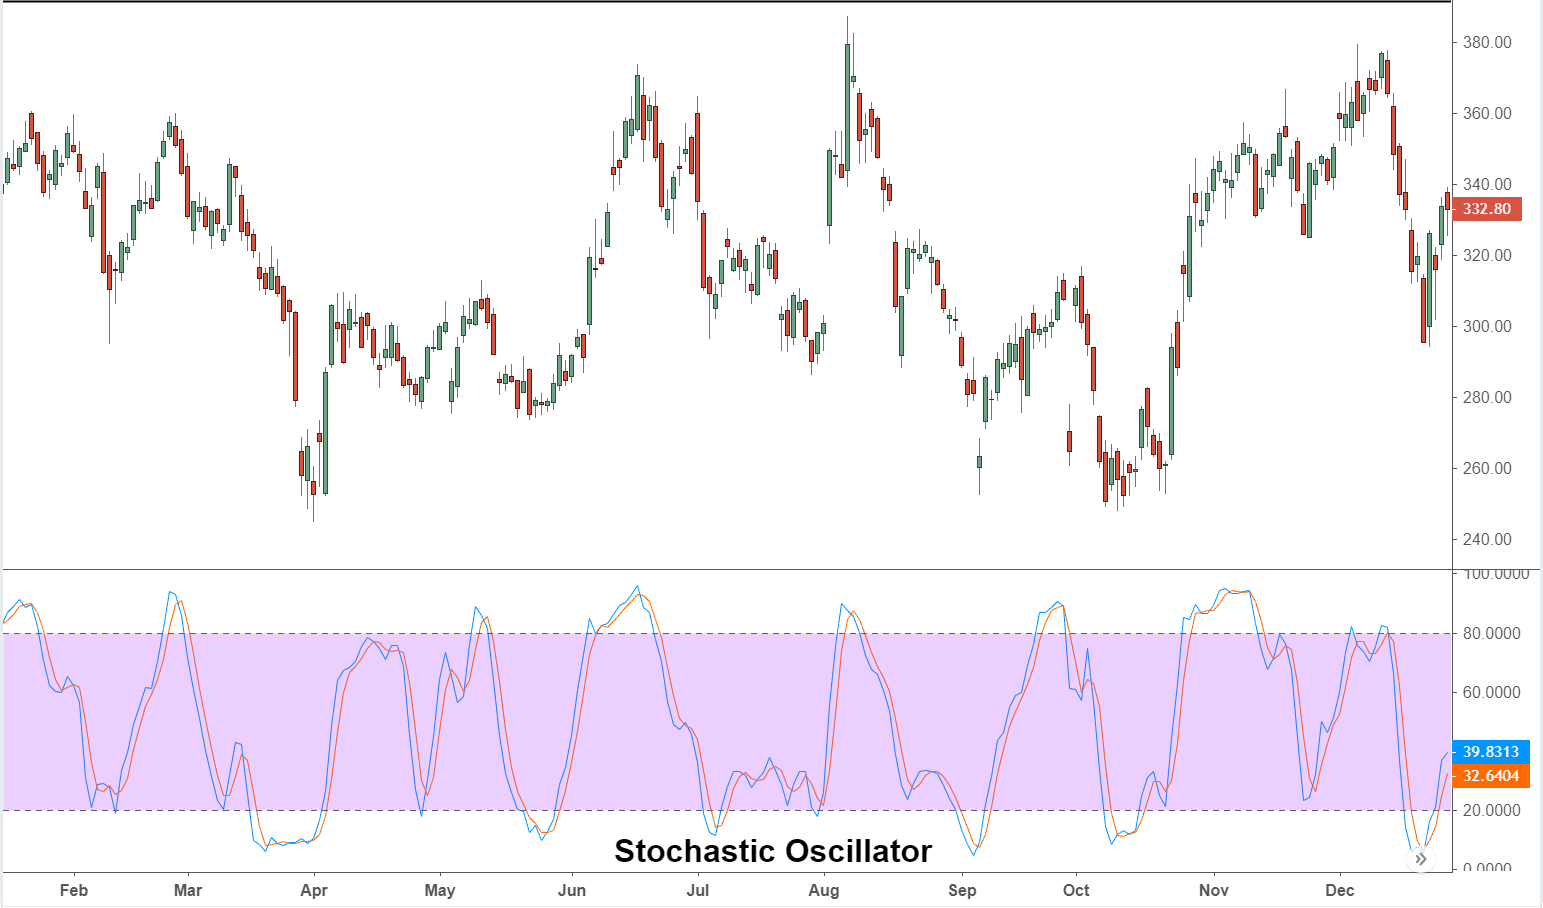
(Image: Investopedia)
Stochastic oscillators are an extremely useful tool in analysing an assets closing price to its values over a specific timeframe. When the closing price of an asset is higher for the specified period, the trend is positive. When the closing price is nearer the low, it clearly shows a downward-facing trend.
Much like the case with ADX, stochastic oscillator values range from zero to 100, where numbers higher than 50 show a strong upward trend, while those ranging below 50 point to a downward trend that could be gaining momentum. It’s worth noting that oscillator readings below 20 indicate oversold conditions in a market that could lead to a reversal to the upside. Similarly, readings of over 80 could mean that the asset has been overbought and a reversal may be imminent.
Conclusion
The approach of momentum investing is clearly a viable strategy for converting appreciating assets into tangible profits, but it’s not without its risks.
Luckily, there’s an array of easily accessible insights out there that means investors have never been better prepared when it comes to identifying investment-worthy trends. Average Directional Indexes and stochastic oscillators help to pave the way for shrewd acquisitions as certain securities are beginning to gather momentum – meaning that there’s a chance that investors could jump on before herd mentality bias kicks in for other onlookers.
However, it’s vital that prospective investors take the time to understand the value of a security ahead of its building momentum. Trends must end, and if an asset is held for too long, there’s a very real danger that prospective profits could fall as it begins to return to its true market value.
Momentum investing certainly has the potential to benefit investors looking to act swiftly and hold assets over a shorter time-frame in the market. If you have a natural eye for detail and a strong attention span, there’s no reason why you won’t flourish as you jump from asset to asset.


![How Options Trading Works: The Ultimate Guide [2021]](https://daglar-cizmeci.com/wp-content/uploads/2020/12/Options-Trading-400x250.jpg)