


The first and most important thing to understand about volatility is that the more volatile a stock is, the riskier the security will be. Volatile stocks are characterised by their tendencies to fluctuate in value more than other investments. They are typically understood, therefore, to be high in risk. Yet, there are plenty of investors out there who are continuously scouring the market looking for the most volatile stocks to snap up and trade.
It’s evident that those with a seriously high appetite for risk are keen to trade in volatile stocks. But there are a few ways to minimise these risks so that every day, novice traders can participate in the buying and selling process of these high and low swinging stocks. Here, we look at what volatility means in the market, explore whether you should invest in volatile stocks, and locate the best places to find volatile stocks.
What is volatility?
In simple terms, volatility is a statistical measure of value that determines the range of returns for a given security or market index. It measures the dispersion through standard deviation or variance between returns.
Standard deviation measures how widely the prices are dispersed from the average price. If prices are trading in a narrow trading range, the standard deviation will return a low value that indicates low volatility.
When volatility is high, the dispersion will be wider as well as the price range. These premises carry the basic principle of investing. The higher the risk, the higher the potential returns. Do remember, standard deviation could go both ways, in both a positive and negative light.
When a highly volatile stock is spread out over a wide range of values, the price of the security can significantly increase or decrease at any given moment. A particularly useful measure of relative volatility is a stock’s beta. Beta is a direct measure of a securities volatility when put up against a particular benchmark. Typically, the S&P 500 is used here.
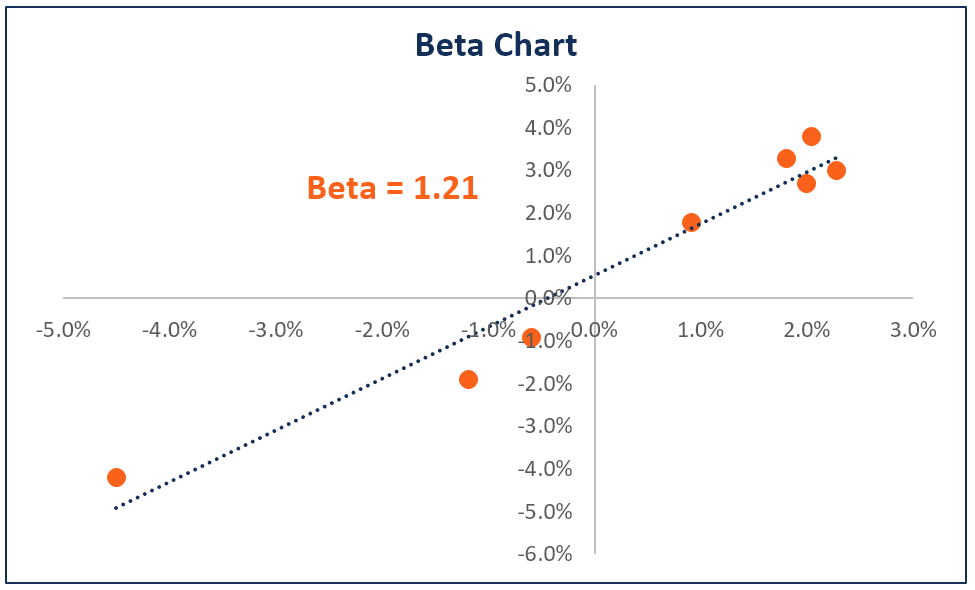
(Beta chart. Image: CorporateFinanceInstiute)
For example, when a stock has a beta value of 1.1, it would suggest that it has moved 110% for every 100% benchmark move. A low beta indicates lower volatility, lower risk, but the lower potential for high returns.
Should you trade in volatile stocks?
The reasons why traders are continuously looking for the most volatile stocks are clear. Simply, there are greater chances for significantly higher returns. Investors who trade in volatile stocks have a greater opportunity to make bigger profits than those who play it safe and stick to low-volatile stocks.
You have to be in the game to win big. Volatility doesn’t necessarily only impact gross profitability. Rather, volatile stocks can make an attractive difference when it comes to net profit too. Basically, if you are looking to generate massive income through investing in stocks, you’ll have to be willing to create a larger profit margin. The best way to do this is to take the risk against volatile stocks. The difference between big wins and chump change is to take this gamble even if profits are not guaranteed.
In a nutshell, without volatility, there is no scope for trading. Price fluctuations are a necessary characteristic of the stock market in order to make any profits at all. Therefore, the question isn’t whether you should invest in volatile stocks, but rather, how volatile should you be willing to go.
Using volatility as a key determinant of stocks selections is both challenging and rewarding. High upswings will often equate to high profits. Do keep in mind the magnitude of loss as well. If you are tempted by the great possibility of gain, you should also be reminded of the great possibility of loss.
Don’t be discouraged from investing in the most volatile stocks on the market. Simply be strategic about your approach to volatile stocks. In the next section, we’ll explore some key strategies for investing in volatile stocks to minimise risk and maximise profitability. At this point in your consideration, do bear in mind your individual circumstances as to how much capital you can afford to invest and potentially lose.
Volatile stock trading indicators
Volatile stocks are characteristic of and prone to sharp movements, which require patience to wait for entries but immediate and quick actions when they appear. As with all stock trading, volatile stocks that are trending can provide a directional bias – giving the trader an advantage.
There are a few indicators that can be used to trade volatile stocks, of the most permanent, monitoring price action is key. That is, watching to see whether the price is making higher swing highs or lower swing lows relative to previous waves. This should be done to determine when indicator signals are taken and when they are left alone.
The two technical indicators to use when trading volatile stocks, include Keltner Channels and Stochastic oscillators.
Keltner channels effectively put an upper, middle and lower band around the price action on a stock chart. This indicator is most useful in strongly trending markets. That is when the price is making higher highs and higher lows for an uptrend, or lower highs and lower lows for a downtrend.
In a strong uptrend, the price will ride the upper Keltner channel and pullbacks will barely reach the middle band and not exceed the lower band. The middle band is the entry point, and a stop is placed between the mid-band and lower band, while an exit is placed just above the upper band.
The same concept is applied to downtrends. Keltner channels are created using the previous 20 price bars, with an Average True Range Multiplier to 2.0. The reward, relative to risk, is typically between 1.5 – 2.0 to 1. Meaning, for each $1 of risk, the potential profit is $1.50 – $2.00.
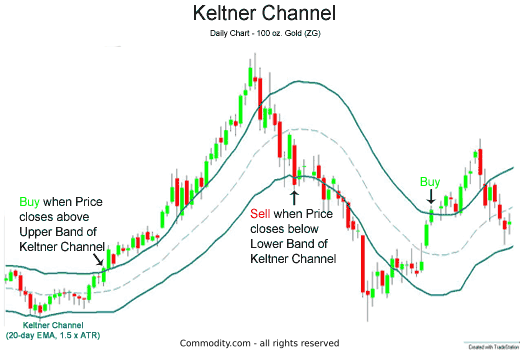
(Keltner Channel. Image: Commodity)
Interpretation of the Keltner Channel can be made simple when looking at the possible buy signal and the possible sell signal. The former occurs when the price closes above the upper band – buy. The possible sell signal is when the price closes below the lower band.
The Stochastic Oscillator is another indicator to use when trading volatile stocks. It’s of particular use for stocks that lack a well-defined trend. Volatile stocks will typically settle into a range before trending in any direction. The next move could create a largely negative position, traders will need some confirmation of a reversal.
The stochastic oscillator measures the momentum of price movements – that is the rate at which the price accelerates or decelerates. The idea behind this indicator is that the speed at which a stock’s price changes, will often change before the price movement of the direction of the stock. So, this tool can be used to predict trend reversals.
The indicator focuses on the location of a stock’s closing price in relation to the high-low range of the price over a set number of previous periods (typically 14 previous periods – either 14 weeks or 14 hours). By reflecting on the closing price to previous movements in price, the indicator seeks to predict price reversals. The two-line indicator can be applied to any chart and fluctuated between 0 and 100. It illustrates how the current price compares to the highest and lowest price levels over time.
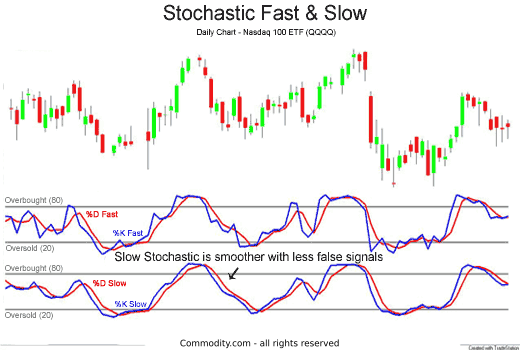
(Stochastic fast and slow. Image: Commodity)
‘Stochastic fast’ plots the location of current prices in relation to the range of prices in previous periods. It uncovers overbought and oversold conditions Above 80 is typically considered overbought and below 20 is oversold.
‘Stochastic slow’ is a similar graph plot but might be viewed as superior due to the smoothing effects of the moving averages – which generates fewer false potential buy and sell signals.
How to find the most volatile stocks
Trading the most volatile stocks possible is an efficient way to trade. This is because, in theory, these types of stocks offer the most profit potential. So, many traders seek out the utmost volatile, but they come to face one serious question when doing so: where to find them?
Some of the most volatile stocks are currently in the energy and medical industries. But with so many alternative industries out there, it can be beneficial to make use of the resources available online to help investors find the most credible information on which stocks are indeed highly volatile and which aren’t.
With that said, finding the most volatile stocks isn’t too complicated and does not require constant screening. Rather, the simplest way to look is to run a stock screen for stocks that are consistently volatile. When doing so, remember that volume is key when trading volatile stocks. The more you find, the easier it will be to enter and exit.
Stock Fetcher is a great tool that filters stocks and enables users to track the most volatile ones. By applying customisable filters – in this case, stocks with average moves greater than 5% per day over the past 100 days, for example, you will be provided with a tailored list of volatile stocks.
The same online tool also filters stocks priced between $10 and $100 with an average daily volume of over 4 million in the past 30 days. Whilst it’s a truly comprehensive tool, if you are only interested in stocks, you can add a filter like “exchange is not Amex” to avoid leveraged ETFs appearing in the filtered search.
Those looking for a more research-led approach to find volatile stocks, one option is to look for them manually. Finviz is a free tool that lists the top gainers, top losers and the most volatile stocks for each day. Its screener tool can help to filter results for market capitalisation, performance and volume. It’s a great way to narrow down searches according to specifications.
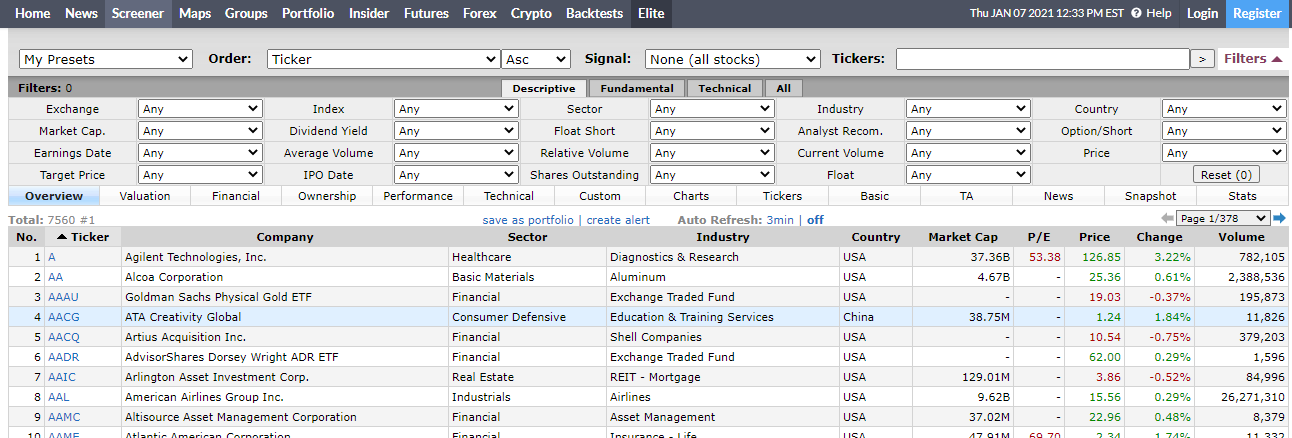
(Screening tool with filters. Finviz.com)
More common trading destinations like NASDAQ and NYSE list the biggest gainers and losers. However, these are not filtered results and will only reflect volatility for that day. So, the lists will only include potential stocks that will continue to be volatile. To implement this strategy into your search for volatile stocks, you’ll need to go through the results manually and see which ones have a history of volatility and of course, enough volume to trade.
Risks and rewards of trading volatile stocks
When volatility is higher than average (volatile stock), it’s expected to come down. When volatility is lower than average, it’s expected that it will eventually come up. In short, volatility moves towards the average. Stock prices will constantly work towards being in equilibrium. After volatile periods there will be consolidation which is the time traders use to evaluate their positions and positions along with the main trend.
Rewards of investing in highly volatile stocks
- High returns
- Lower cost
- Lower demand in the market
- Fall in the market value
- Accommodates most investment goals
High returns
As well as swinging high in price, highly volatile stocks are typically issued by small and mid-cap companies. They can often be issued by startups showing tremendous potential for growth. Such companies usually offer goods and services of high demand in the market. These highly volatile stocks combined with robust growth potential with adequate cash flow and favourable market conditions can also work as value investment securities since their share prices in the future are forecast to grow.
Lower costs
Since many highly volatile stocks are of small and mid-cap companies, they trade at relatively lower prices compared to securities issued by large and blue-chip organisations. A lower investment input on a highly volatile stock could prove to be significantly profitable and minimise risk since the initial investment is kept low.
Lower demand in the market
Stocks of high volatility typically have lower demand in the market – especially during times of economic downturn. When investors are unsure about the performance of a company during times of stock market downtrend, many will be hesitant to risk investing in highly volatile stocks.
Fall in the value of the market
The market value of a company as reflected by its market capitalisation is generally low for organisations issuing high volatile stocks. This is due to the lower share price valuation as well as fewer outstanding shares in circulation. Purchasing an undervalued, highly volatile stock of a promising company can help investors earn long term capital gains.
Suits most investment goals
Investors with both short and long term investment plans can and should opt to trade in highly volatile stocks. When growing companies perform well during times of economic prosperity through increased cash flow and demand for goods and services, investors holding highly volatile stocks can earn profits for a short lock-in period.
Although, it should be mentioned that for short-term traders, volatility is even more critical to their strategies. Day traders, i.e. short-term traders depend on changes that happen on a minute by minute or second by second basis. If there is no price change, there is no profit. Swing traders can operate in a slightly longer time frame – typically days or weeks. However, volatility is still central to their trading strategy.
Stock prices are more than likely to demonstrate some linear growth in the long term – ensuring substantial long term capital gains on locked-in investments.
Risks of investing in highly volatile stocks
Having realised the substantial potential rewards associated with trading in highly volatile stocks, it should be noted that such securities come with equally substantial associated risks.
- Wider market fluctuation
- Value trap
- Sectoral downtrends
- No dividends
- Taxation
Market fluctuations
Highly volatile stocks are always affected by any market fluctuation. A negative outlook on the stock market trends, or adverse socio-political events, can cause significant fluctuations in the stock prices. Most companies issuing volatile stocks rely heavily on equity sources to form the basis of operational expenses. When the economy is experiencing a downturn, investor panic follows, withdrawing money from the company, which reflects poorly on annual revenue.
Such fluctuations in the stock prices can result in losses for investors with short term investment goals since market downtrends can last for up to a year.
Value trap
Companies ranked in high volatility stocks lists are rarely accurately displayed according to their market value. Investors can fall into the trap of attributing undervalued shares to unsystematic risks, without taking into account the financial foundation and management of the company. To avoid falling into the value trap, investors should look at the true potential of even the most volatile stocks by examining intrinsic value indicators such as the price to earnings ratio.
Sectoral downtrends
Stocks of high volatility are often subject to sectoral performance, of which is dependent on business cycle fluctuations. It’s not uncommon for some companies to demonstrate excellent performance during sectoral downtrends. This leads uncautious investors to believe that such companies can be profitable ventures. However, it’s paramount for investors to evaluate the intrinsic technical analysis variables in order to conclude the true potential of growth, rather than simply rely on market conditions.
No dividend pay-outs
Considering the fact that highly volatile stocks are primarily issued by companies with a market capitalisation of less than $2 billion, revenue that is generated by these companies is more often than not, reinvested back into the business to fund its expansion and growth. As such, investors do not enjoy any periodic dividend benefits on their respective equity shares. Whilst this is not necessarily a ‘risk’ associated with highly volatile stocks, it’s certainly worth considering.
In short, highly volatile stocks may not exactly be ideal for any investors looking for investment opportunities that will generate a steady income. Rather, investors who depend on the sharp swings in price to buy and sell stocks at a profit could do well in trading in volatile stocks.


![How Options Trading Works: The Ultimate Guide [2021]](https://daglar-cizmeci.com/wp-content/uploads/2020/12/Options-Trading-400x250.jpg)